March 2024
Special Focus: Petrochemical Technologies
Control primary properties online in polyethylene and polypropylene rectors by using functional correlations
Polyolefins products such as high-density polyethylene (HDPE), linear low-density polyethylene (LLDPE), low-density polyethylene (LDPE) and polypropylene (PP) form approximately 65%–70% of all polymers manufactured globally.
Polyolefins products such as high-density polyethylene (HDPE), linear low-density polyethylene (LLDPE), low-density polyethylene (LDPE) and polypropylene (PP) form approximately 65%–70% of all polymers manufactured globally. These polyolefin products are termed performance products because they are characterized by their application performance and how their customers use them. Specific fundamental physical and chemical properties characterize these end-use performance attributes. These are referred to as the primary properties of polyolefins or polymers. The polymerization reactors control these primary properties to produce polymer products suitable for end-use applications.
The emphasis of this article is to define guidelines to establish functional correlations between measurable and controllable reaction parameters with fundamental primary properties to enable continuous online monitoring and control of the polymerization reaction to yield consistent product quality.
Primary properties
The properties discussed here are molecular weight (MW), density and molecular weight distribution (MWD) for polyethylene (PE) and xylene solubles (XSs)—the inverse function of the isotacticity index for PP. Density and MWD play a relatively minor role in applying PP products and are not controlled, unlike PE.
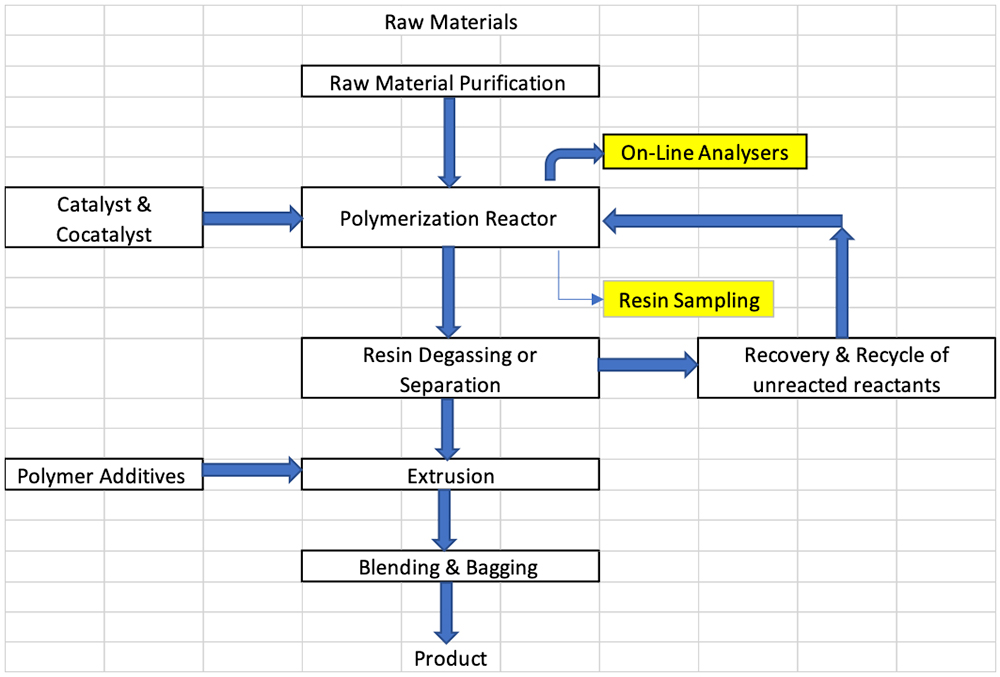
These primary control properties of PE and PP are controlled in the polymerization reactor stage. These primary control properties apply to all types of polymerization reactors [e.g., the fluidized-bed gas phase, stirred-bed gas phase, bulk phase, loop slurry and continuous stirred tank reactor (CSTR)]. The typical process flow in any PE or PP plant uses the following sequence:
The preparation and purification of raw materials → polymerization reaction → polymer degassing and separation → recovery and recycle unreacted reactants and other components → extrusion and compounding → blending and bagging.
Polymer properties are controlled at the reactor stage by direct or indirect measurements. Direct measurement is done by withdrawing the resin sample from the reactor system and analyzing it at a quality control laboratory (QC lab) to determine its specific properties. Indirect measurement is done by an online analysis (online analyzers) of related gaseous or liquid components that can be correlated with base resin properties.
Depending on the test methods, direct sampling takes time to analyze; consequently, results can take 1 hr–4 hr to receive. Indirect analysis is practically instantaneous and can deliver the results online within seconds or minutes. Indirect or online measurements are key to controlling the reactor and, hence, the resin properties. The corrective actions that follow the online results or indications can be by manual interface or automatic mode through distributed control system (DCS) control.
The need for quick analysis to have immediate corrective actions arose due to advancing polyolefins technologies that have increased plant capacities from 15 metric tons per hour (tph) to 20 tph in the past to 70 tph–75 tph in modern plants—this minimizes the product that falls outside the desired specification window or the generation of off-specification (off-spec) product to improve the economics of the plant. The focus of this article is to outline the principles and methods of online reactor control by using fundamental correlations. A simplified block flow diagram of a polymer plant, as depicted in FIG. 1, exhibits the typical sampling location, whether online or manual.
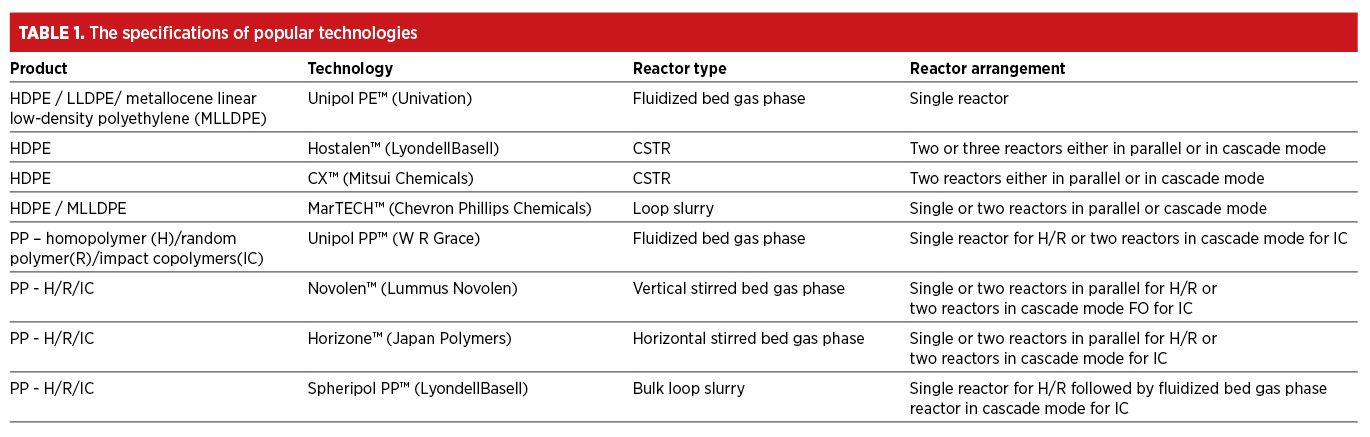
Reactor arrangements
Reactor arrangements vary depending on the type of technology and product group. TABLE 1 summarizes the specifications of popular technologies.
Control of the primary properties of polymers
Industry literature widely defines the structured relationship between MW, melt flow index (MFI), density and comonomer concentration. Only the concluding correlations, based on measurable parameters in the reactor control, are specified. The correlations for MFI and density for PE are shown in Eqs. 1, 2 and 3:
Log MFI = A + B x Log [hydrogen (H2)/ethylene (C2H4)] (1)
Log density = A – B x Log [butene 1 (C4H8)/ethylene (C2H4)] for butene 1 comonomer (2)
Log density = A – B x Log [hexene 1 (C6H12)/ethylene (C2H4 )] for hexene 1 comonomer (3)
Where A and B are constants, depending on the catalyst system, the processes used in the plant are different for each correlation. H2, C2H4, C4H8 and C6H12 are the concentrations of H2, ethylene, butene 1 and hexene 1, respectively, in the reactor gas phase. The correlations for MFI and XS for homopolymer PP (HPP) are shown in Eqs. 4 and 5:
Log MFI = A + B Log [H2/propene (C3H6)] + C [aluminium alkyl (AL)/donor] (4)
Log XS = A – B x Log (catalyst/donor) (5)
The correlations for random PP (RPP) are shown in Eqs. 6 and 7:
Log MFI = A + B Log (H2/C3H6) + C (AL/donor) – D (C2H4/C3H6) (6)
Log XS = A - B x Log (catalyst/donor) + Log (C2H4/C3H6) (7)
The impact copolymer PP (ICPP) is controlled by the HPP and RPP (Eq. 8):
Log MFI = A + B Log (H2/C3H6) + C Log (H2/C2H4) (8)
A, B and C are constants specific to the plant and are different for each equation.
LDPE is differentiated from HDPE, LLDPE or metallocene linear low-density polyethylene (MLLDPE) by its polymerization mechanism. Ethylene polymerization to LDPE is carried out at extremely high pressure and moderately high temperature following a radical mechanism. The reaction pressure can vary from 1,500 kg/cm2g–3,000 kg/cm2g, depending on the polymerization process. The reaction temperature varies from 250°C–300°C. The autoclave reactors are usually operated at 1,500 kg/cm2g–1,800 kg/cm2g, and tubular reactors are typically operated at 2,500 kg/cm2g–3,000 kg/cm2g pressure and 250°C–300°C.
The ethylene is polymerized to LDPE, using organic peroxides as reaction initiators. The organic peroxides are not proprietary, unlike catalysts for other PE and PP processes, and are commercially available. The primary properties of the MFI and density are controlled by reaction pressure, peak temperature in each reaction zone and chain termination agents (sometimes called modifiers).
The most popular modifiers are propylene or propionic aldehyde (PAL). Propylene modifies lower density ranges from 917 kg/m3–922 kg/m3. PAL is typically used as a modifier for the higher density ranges from 922 kg/m3–932 kg/m3. In other words, the PAL flowrate controls the MFI, keeping the reaction pressure and temperature constant (Eq. 9):
Log (MFI) = A + B x Log (PAL) (9)
where PAL is the ratio of PAL-to-ethylene in the feed to the reactor.
A and B are plant- and technology-specific constants. Density is a more complex property because it depends on the pressure and temperature (Eq. 10):
D = A0 – A1 x T + A2 ^2 x P (10)
where A0, A1 and A2 are constants specific for the plant, T is at peak temperature and P is the reactor pressure.
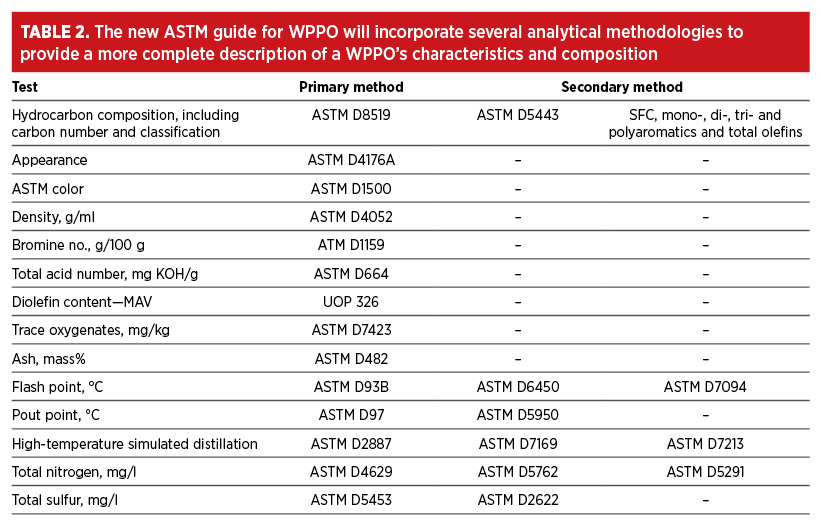
The conversion of ethylene to LDPE is limited to < 40% and generally ranges from 26%–36%, depending on the reactor conditions used to produce different product grades. Economics always favor the higher conversion; consequently, the reactor conditions are optimized to produce the product at the highest possible conversion. TABLE 2 summarizes the effect of critical parameters on key properties and the conversion.
How to generate the functional correlations
All plants have a multifunctional DCS capable of storing large amounts of data and conducting complex calculations. Every plant compiles large quantities of QC properties data results, namely MFI, density, MWD and XS. This data can generate appropriate equations, as illustrated in the previous correlations.
One important point to consider while developing these equations is the catalyst system used in the plant. Each catalyst system has unique characteristics and behaviors concerning catalyst activity, H2 and comonomer responses. These will affect the constants in the equations but not the fundamental functionality. Depending on technologies, some plants use multiple catalyst systems to produce different products, so functional correlations must be developed for each catalyst system.
These equations can be configured in a DCS, as calculation blocks drawing results of online analyzers are exhibited in the DCS. The continuously calculated values of the MFI, density or XS can be used offline to control the relevant reaction parameters like H2, butene 1, cocatalyst and donor flows. The accuracy of the results can be regularly compared with those obtained from the QC lab, and any fine-tuning of equations can be done, when necessary.
Most PE or PP plants do not use an advanced process control (APC) unless mandated by the technology providers. Even if an APC is installed, its functioning and accuracy depend on functional correlations. It is also observed that over time, the importance of such fundamental functional correlations is only remembered when a problem arises due to inconsistencies or fluctuations in quality. These correlations can play a significant role during grade transitions, which are intended to save transition time and, therefore, restrict or minimize off-spec production. Configuring these correlations does not require investment.
Takeaway
The functional correlations for monitoring and controlling the primary properties of PE and PP tend to inculcate discipline in reactor operations and reflect the consistency of the product’s quality. Different computational tools, such as statistical process control or inferential network models, can also generate correlations based on polymerization fundamentals. These functional correlations go a long way in ensuring consistent product quality, which is the hallmark of PE and PP product applications. HP
The Author

Jayant D. Divey is a polyolefins technology consultant supporting clients in technology evaluation and selection, process design and troubleshooting for polyolefin and petrochemical plants. He retired from Reliance Industries Ltd. as the Senior Vice President responsible for polyolefins technologies in integrated petrochemical complexes. Divey has more than 40 yr of experience with PE and PP technologies and has published several articles on the subject. He has also worked as a technology manager in fluid catalytic cracking light olefins handling C2–C5 hydrocarbons. He has led many projects from concept to commissioning through design basis and engineering. Divey earned a BS degree in chemical engineering from the Laxminarayan Institute of Technology Nagpur University and an MS degree from the Indian Institute of Technology Bombay.


Comments