
2021 AFPM Summit Virtual Edition: COVID-19: A reset in asset integrity management using wireless UT sensors to augment manual inspection
STEVE STRACHAN, Sensor Networks Inc.
For decades, many asset owner-operators across the oil and gas upstream, midstream and downstream value chains (and other critical industry segments) have struggled to identify the root cause of fluctuating corrosion/erosion rates due to unreliable or infrequent data during various operating intervals on their most valuable of assets.
This key missing data point has forced mechanical integrity teams, corrosion engineers, inspectors and operations to, in many cases, make the best guess or hypothesize how to operate with a limited data set of information. In almost all cases, a time-based inspection or maintenance interval is used to gauge the useful lifetime of assets based on this limited data simply because these assets could not give their owners a real-time health diagnostic of how they were doing…until now.
This article will detail how COVID-19 offered a much-needed reset button of opportunity for asset owners across many segments to rethink their decision-making process by using technology to their favor. Many of these asset owners can now take the next leap into strategic asset integrity planning by utilizing sensors and real-time data to not only safely and more efficiently operate assets but also, in some cases, achieve the financial holy grail of life-extension services for their most critical assets and components.
The concept for deployment of permanently or temporarily installed ultrasonic sensors to either replace or augment manual inspections is by no means a newfangled idea. The first versions of installed sensors were hard wired and introduced more than 20 years ago and extremely niche, as they were expensive and quite limited in capability.
As with all technology, components get smaller, have more computing power, can be more easily deployed/integrated and ultimately become more affordable. The same can be said about installed UT sensors. Over the last 10 years especially, the installed sensor concept has seen vast technological advancements. Today, sensor systems come in all shapes and sizes that can be offered as a solution to just about any application:
- Single-point, multi-point and even area coverages
- Wired (integrated to SCADA/PLC/DCS) or wireless (2.4GHz, 900MHz/LoRa, cellular, satellite, etc.)
- Extremely high (1,100°F/593°C) or low temperatures (–40°F/–4°C)
- Buried or above ground
- Permanently or temporarily installed.
Given the vast improvements in this arena, it is easy to see why so many asset owners and end users have embraced the concept and found places to leverage the technology. Today, asset owners, manufacturers and operators across nearly every industrial segment (oil and gas, power generation, pulp and paper, mining, etc.) are looking for ways to cut costs, improve efficiency and maximize safety.
In the current environment (perhaps now more than ever before), where time is money and even the slightest edge can mean the difference between profit, breaking even and loss, it is of paramount importance to analyze where and how human resources and technology are being utilized and deployed. When relating to installed UT sensors to replace or augment manual inspection, the industry isn’t heading that way—it’s already here.
Asset owners who are leveraging installed UT sensor technology are learning more than ever before with regard to plant efficiencies, feed stocks, chemicals, inhibitors, and how to move from a time-based maintenance interval to a predictive-based interval, leaving those who are not in the dark ages of asset integrity prioritization and management.
Perhaps the most important differentiation being recognized (and put into practice) across nearly every major industrial segment is that of inspection vs. monitoring. In the past, the millions of dollars being invested each year in annual inspections got lost in reporting and compliance requirements vs. being leveraged to understand where the most critical areas of wall loss are being experienced.
Today, these precious inspection budgets are being used to baseline where there are “bad actor” or trouble spots that lend themselves to a more strategic monitoring approach. Enter wireless UT sensors. The case study below explains how one refiner put inspection vs. monitoring into practice and was able to use both inspection and monitoring in tandem to bolster a wholistic (and strategic) asset integrity management plan, realizing millions of dollars in savings.
Case study: Sulfur recovery unit (SRU)/Amine unit corrosion. The refiner had corrosion issues at their amine unit “for as long as we could remember,” and presumed the issue was simply a mechanical design flaw. For the last 20+ years, they were sending an NDE inspector to take readings at 12 different locations across the unit three times per year. The previous manual inspections seemed to show an average corrosion rate of 80 mpy. However, during the last 20 years—and, seemingly, even more the last five to 10 years—the corrosion seemed to be more and more unpredictable, to the point where the team decided they needed to replace the piping in these areas every three years.
The cost of manual inspection was roughly $12,000/yr in these locations and they concluded this was the most cost effective and safest solution (vs. upgrading metallurgy, injecting unknown quantities of inhibitor, etc.) to operate the asset. That is, until one young engineer asked the question, “Does it make sense to try to find some other way to monitor these locations vs. the traditional way of inspecting them manually? Perhaps it will get us more data to make a more informed decision on how to run the unit?”
After about a 10-min Google search, the engineer found a solution that he thought would be viable. The solution was a 900-MHz wireless UT sensor system that could accommodate single-point sensors that could be installed permanently or temporarily in a matter of minutes. The engineer then scheduled a call with the vendor to get more information on the hardware, software, installation and wireless details. After collaborating with the different site teams (inspection, corrosion/metallurgy, water/process, operations and IT/security), the green light was given. A month later, the sensors arrived and within a day were installed and collecting data at the critical 12 locations. FIG. 1 depicts an example of one of the sensors fully installed.
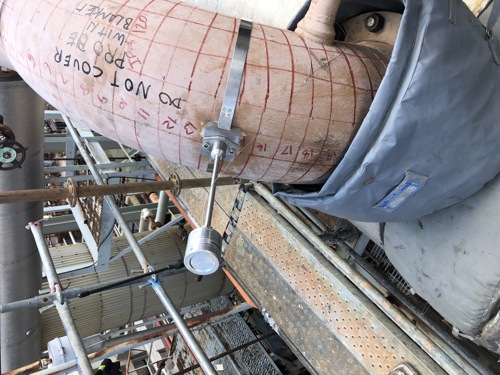
FIG. 1. Single-point sensors can be installed permanently or temporarily in a matter of minutes.
FIG. 2 shows an example of data the asset owner collected by employing wireless UT sensors to monitor these critical areas and overlaying the wall thickness/corrosion data with that of the operational/process data. Findings include:
- Corrosion rates vary significantly based on operational inputs/parameters
- Inspection technique corrosion rate: 80 mpy
- Monitoring technique corrosion rate: variable and with .001-in. accuracy across a calendar year of data
- Process changes and remediation efforts can significantly change corrosion rates
- 3 shows where the refiner was able to draw boxes around particular integrity operating windows (IOWs) and data sets to determine the corrosion rate.
- Note: The process changes that were employed across the year (end-April, end-May, mid-August, mid-December) and the resulting corrosion rates.
- The refiner was able to map each process to understand exactly the resulting corrosion rate if/when the unit was run a certain way for a certain amount of time.
- Financial impact:
- Before monitoring:
- $12,000/yr for inspection
- No real discernable corrosion rate
- Replace piping regardless every three years
- After monitoring:
- $50,000 investment in 12 sensors/hardware/software/installation
- Ultra-precise corrosion rate data throughout a year
- Extended replacement from 3-year to 5-year, saving $6.8 MM.
- Before monitoring:
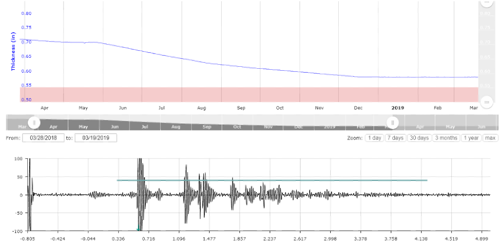
FIG. 2. An example of data the asset owner collected by employing wireless UT sensors to monitor critical areas and overlaying the wall thickness/corrosion data with that of the operational/process data.
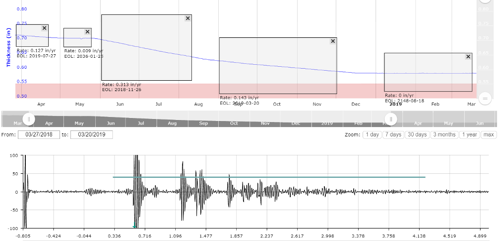
FIG. 3. The refiner was able to draw boxes around particular integrity operating windows (IOWs) and data sets to determine the corrosion rate.
ABOUT THE AUTHOR
Steve Strachan is the VP of sales for Sensor Networks Inc. (SNI), a technology company that manufactures remote monitoring equipment for critical assets in industrial sectors. SNI designs wireless UT sensors, remote visual cameras and retrieval equipment, and conventional and phased array transducers for a multitude of inspections, robotics and asset integrity solutions. Mr. Strachan is a graduate of Pennsylvania State University. Prior to joining Sensor Networks Inc., he worked for GE Inspection Technologies as a graduate of the Commercial Leadership Program and as a Regional Sales Manager and Product Manager for Ultrasound, Digital Radiography and Handheld XRF (PMI).


Comments