
US chemical business cools in September amid economic slowdown
9/22/2015 12:00:00 AM
The Chemical Activity Barometer (CAB), a leading economic indicator created by the American Chemistry Council (ACC), dropped 0.4% in September, following a revised 0.2% decline in August, the trade group announced Tuesday.
The pattern shows a marked deceleration, even reversal, over second-quarter activity.
Data is measured on a three-month moving average (3MMA). Accounting for adjustments, the CAB remains up 1.2% over this time last year, also a deceleration of annual growth. In September 2014, the CAB logged a 4.1% annual gain over September 2013. It is unlikely that growth will pick up through early 2016.
 The CAB has four primary components, each consisting of a variety of indicators: 1) production; 2) equity prices; 3) product prices; and 4) inventories and other indicators. During September, chemical equity and product prices were down, production was flat, and inventories moderated.
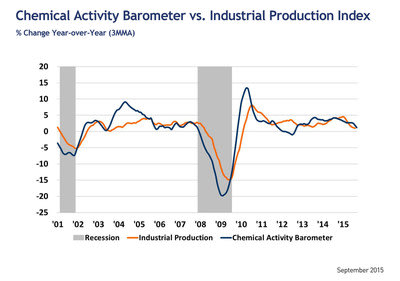
The CAB is a leading economic indicator derived from a composite index of chemical industry activity. The chemical industry has been found to consistently lead the US economy's business cycle given its early position in the supply chain, and this barometer can be used to determine turning points and likely trends in the wider economy.
Month-to-month movements can be volatile so a three-month moving average of the barometer is provided. This provides a more consistent and illustrative picture of national economic trends.
Applying the CAB back to 1919, it has been shown to provide a lead of two to 14 months, with an average lead of eight months at cycle peaks as determined by the National Bureau of Economic Research. The median lead was also eight months. At business cycle troughs, the CAB leads by one to seven months, with an average lead of four months. The median lead was three months. The CAB is re-based to the average lead (in months) of an average 100 in the base year (the year 2012 was used) of a reference time series. The latter is the Federal Reserve's Industrial Production Index.
"Business activity cooled off in September," said ACC chief economist Kevin Swift. "Chemical, other equity, and product prices all continued to suffer, signaling a likely slowdown in broader economic activity.
"One bright spot continues to be plastic resins, particularly those used in light vehicles," he added. "Sales of light vehicles are on track to record a banner year, the best since 2000." Light vehicles are a key end use market for chemistry, containing nearly $3,500 of chemistry per vehicle.
Also at play is the ongoing decline in US exports. According to Swift, global trade is lagging behind both global industrial production and broader economic activity with deflationary forces at play. With this month's data, the CAB is signaling slower gains in US business activity into early 2016.


Comments